



 MES insight
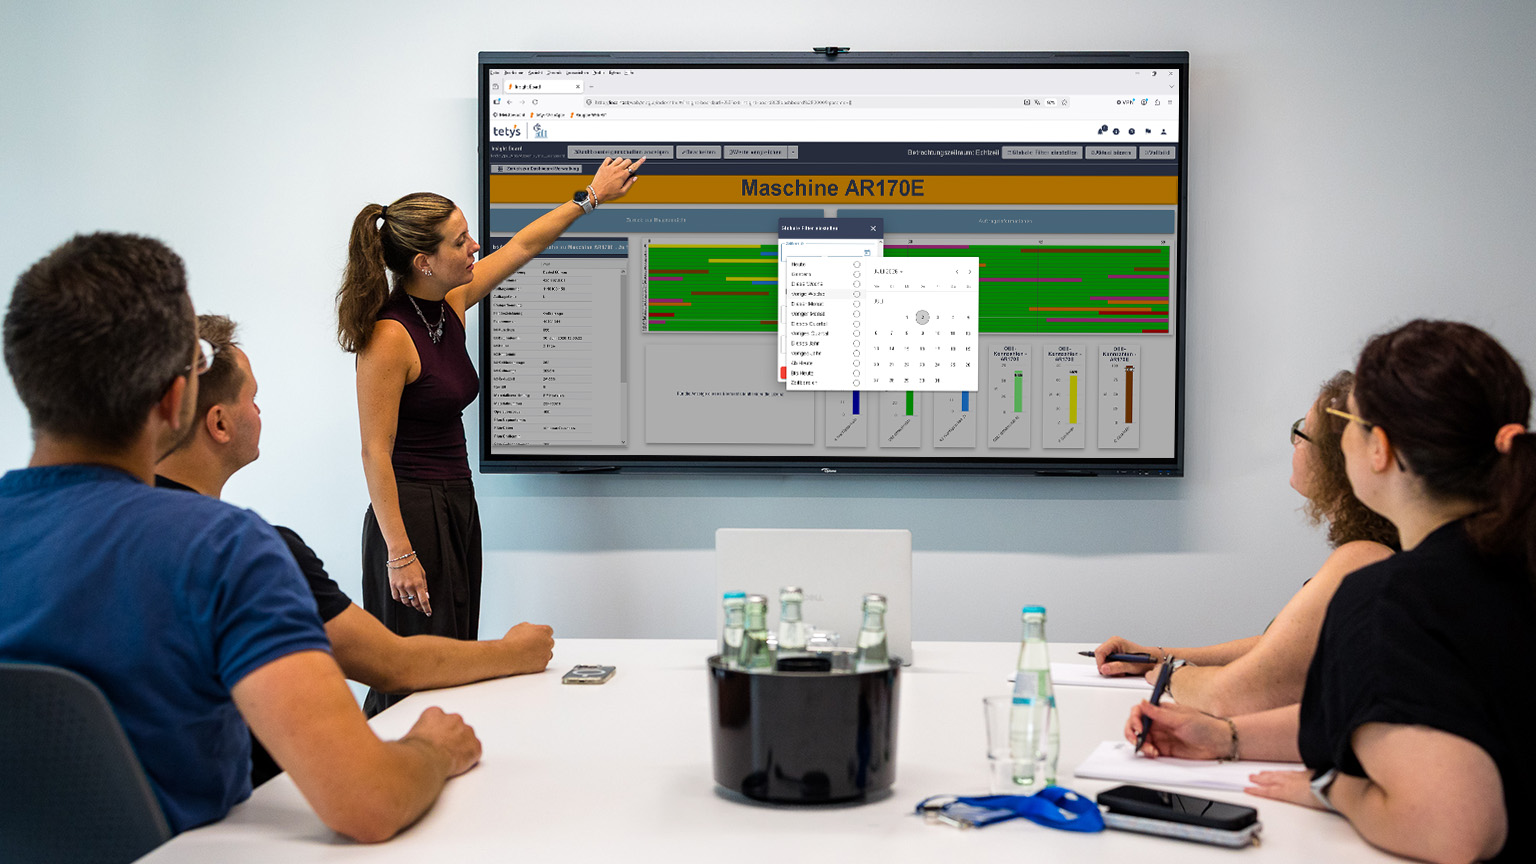
_Key figures that guide decision-making.
Production data is worthless if you find yourself drowning in confusing columns of figures. tetys MES insight translates historical big data into clear, decision-relevant KPI dashboards.
_Key figures that guide decision-making.
Production data is worthless if you find yourself drowning in confusing columns of figures. tetys MES insight translates historical big data into clear, decision-relevant KPI dashboards.
_The solution to the fragmentation of management data
Plant managers and COOs are often faced with a mountain of inconsistent data sources and reports. Although machines diligently generate cycle data, manually aggregating this data from the ERP, machine control and HR systems often takes until the end of the month. The controlling report is therefore out of date by the time it is discussed. Gradually emerging causes of production line faults on individual machines, declining set-up efficiencies or fluctuations in cycle times thus remain completely invisible in day-to-day operations.
_The solution to the fragmentation of management data
Plant managers and COOs are often faced with a mountain of inconsistent data sources and reports. Although machines diligently generate cycle data, manually aggregating this data from the ERP, machine control and HR systems often takes until the end of the month. The controlling report is therefore out of date by the time it is discussed. Gradually emerging causes of production line faults on individual machines, declining set-up efficiencies or fluctuations in cycle times thus remain completely invisible in day-to-day operations.
_Your structured dashboard for the shop floor
We make factory efficiency objectively measurable. MES insight provides a robust business intelligence (BI) foundation for identifying trends, variances and best practices.
Comprehensive OEE calculation
Provision of objective Overall Equipment Effectiveness (OEE), broken down precisely into the contributing factors of equipment availability, performance rate and quality rate.
Pareto-based root cause analysis
Rather than simply knowing that 10 per cent of the shift was spent on downtime, you can use the Pareto chart to pinpoint the exact, dominant cause of the disruption (e.g. a crack in the material or a faulty relay).
Machine benchmarks
Compare systems of identical design, different shifts or entire assemblies objectively with one another in order to establish company-wide best practices regarding set-up and cycle times.
 Inside the Code
Drill-down & Reporting
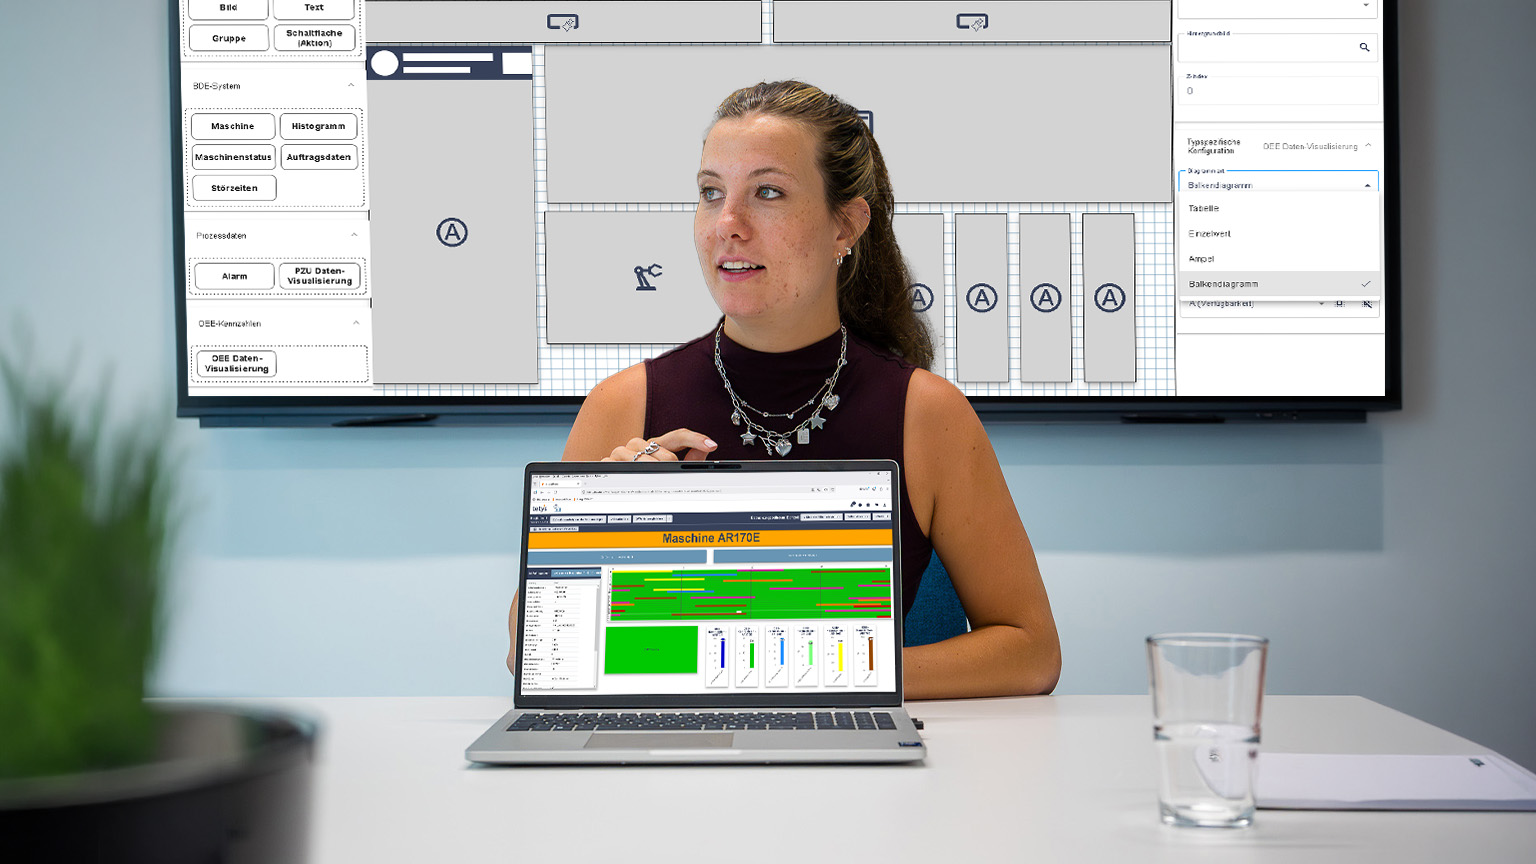
tetys’ business intelligence architecture enables in-depth drill-downs: With just a few clicks, you can zoom in from the cumulative plant benchmark to a machine group, a single piece of equipment, or an individual machine—all the way down to a specific production order—allowing you to identify the root causes of any issues. Or you can view the process values or alarms for your production cells. Or you can define management reports for your next business meeting. The web-based MES insight gives you maximum flexibility in configuring your BI dashboards.
Inside the Code
Drill-down & Reporting
tetys’ business intelligence architecture enables in-depth drill-downs: With just a few clicks, you can zoom in from the cumulative plant benchmark to a machine group, a single piece of equipment, or an individual machine—all the way down to a specific production order—allowing you to identify the root causes of any issues. Or you can view the process values or alarms for your production cells. Or you can define management reports for your next business meeting. The web-based MES insight gives you maximum flexibility in configuring your BI dashboards.

_Discover new profit margins
You can only scale what you can measure in detail and on an ongoing basis.